Village of Data
- Rachael Prime
- May 24
- 3 min read
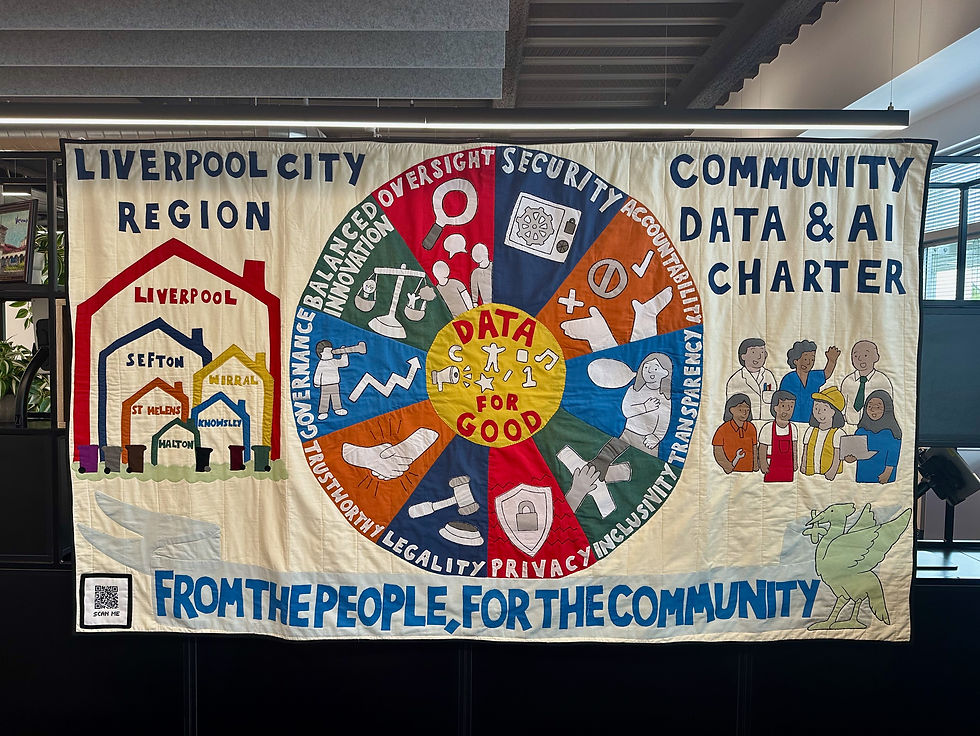
Village of Data is a co-creation piece commissioned by Civic Data Cooperative as part of the Festival of Data.
Working with open source datasets, the piece explores housing, transport and environmental quantitative data, creating a physical visualisation of the Liverpool City Region.
As the project was to be co created with Year 6 school children, I drew on memories of my own primary classroom as a starting point. In particular, I was inspired by the carpeted areas printed with village and town patterns that children would sit and play on.

Structure of the Piece
The installation is constructed in three layers.
The first layer, the ground layer, is based on the Greenness Grid from Natural England. This dataset maps the percentage of man made surface within 250 metre grid squares, identifying areas that are not water, vegetation or soil. The data was translated into hand painted carpet tiles, forming the mapped structure of the Liverpool City Region.


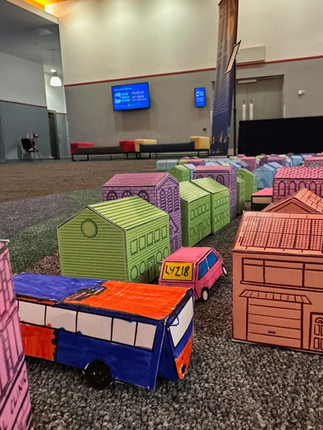
The second layer, the building layer, incorporates multiple datasets. The primary dataset is a heat map from Geographic Data Services showing the ages of dwellings across the Liverpool City Region, grouped largely by decade of construction, with wider date ranges during the World War years where data collection was less consistent.
Each miniature house represents 2000 dwellings or households, totalling over 676,000 dwellings across the region. Schools and GP surgeries are also represented within the model, with each building standing for ten real world sites.
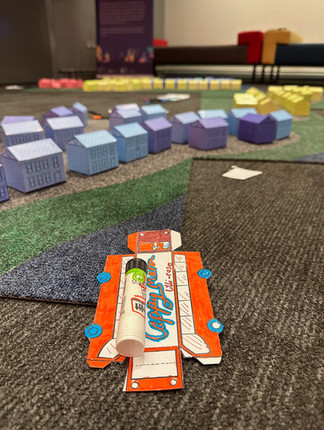
The third layer, the transport layer, represents transport data within the region. Miniature buses represent households who use public transport, walk or cycle to work, with each model representing 2000 households. Cars represent households who own at least one vehicle, again with each model representing 2000 households.
Co-Creation
As part of the Festival of Data, two Year 6 classes visited to help construct the work.
The children began by laying out the mapped carpet tiles before placing the houses using a simplified version of the dwelling's age heat map to guide distribution.
Interestingly, the piece naturally developed to reflect the density of the region. The more urban areas became heavily populated with buildings, while the outer towns remained more spaced out. The physical limitations of the ground layer guided this outcome, allowing the geography of the region to emerge through placement.


The children then created the cars and buses that populated the model, using their own ideas and references for the designs.
During this process, it became immediately clear that the number of cars dramatically outweighed the number of buses. The volume was so significant that the children were unable to complete the full number required to accurately represent the data. This continued during the public session but with over 472,000 households in the region owning at least one car this required number was still not reached.
Reflection
In developing the project further, I would involve the children more deeply in the design of all visual elements.
The original intention was for the Year 6 class to design each component before the forms were digitally edited and reproduced. Due to time constraints, my own illustrations were used for the building layer, with the children contributing directly to the transport layer.
The work was well received during both the conference and public days of the festival. It prompted conversations around the historical development of housing, environmental concerns relating to transport choices, and the experience of seeing familiar towns and cities visualised through data. Many visitors located their own area within the model and used it as a starting point for discussion.

Village of Data demonstrates how open source civic data can be translated into a visual and engaging form. By taking digital statistics and making them physical, the project invited the audience to consider how housing, environment and transport shape everyday life.
Projects such as Village of Data created opportunities for residents and communities to engage with scientific topics and processes in accessible ways, encouraging them to question, understand and reflect on data that directly relates to their own lives and families.
Related Websites
Geographic Data Services - Heat Map
Natural England - Greenness Grid

Comments